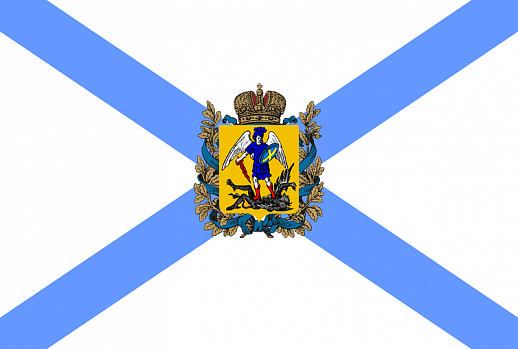
 Arkhangelsk Region
Arkhangelsk Region (passport)
Arkhangelsk region.
Date of Foundation
Arkhangelsk region was formed on September 23, 1937 as a result
of Northern area of RSFSR separation.
Geographical Position
Arkhangelsk region is located in the North-European part of Russia.
Its coast is washed by the waters of the White Sea, the Barents Sea and the Cara Sea. In terms of territory Arkhangelsk region is contiguous with the Republic
of Komi, Kirov region, Vologda region and the Republic of Karelia.
The region incorporates territories of Nenets Autonomous District, Novaya Zemlya Island and Franz Josef Archipelago.
Federal District
The region is a part of the North-West Federal District.
Territory
Arkhangelsk region occupies the territory of 413.1 thousand km2 (excluding Nenets Autonomous District), 589.9 thousand km2 (including Nenets Autonomous District).
Population
As of January 1, 2022 the population of Arkhangelsk region is 1 069.8 thousand people. The density is 2.6 people per 1 km2 with 78.7% share of urban population (as of January 1, 2022).
Cities
The administrative center of the region is Arkhangelsk with the population
of 352.0 thousand people (according to the data of January 1, 2021). The largest cities of Arkhangelsk region are Severodvinsk (181.8 thousand people), Kotlas (74.7 thousand people), Novodvinsk (37.3 thousand people), Koryazhma
(35.3 thousand people).
National Composition of the Population
National composition of Arkhangelsk region population is comparatively homogeneous. According to national population census data (2010), 98% defined their nationality and their national diversification as follows: the Russians – 94.7%, the Ukrainians – 1.4%, the Belarusians – 0.5%, the Nenets – 0.04%, the Komi – 0.08%, the Tatars – 0.2%, other nationalities – 1.1%.
Socio-Economic Situation of Arkhangelsk region
Gross Regional Product of Arkhangelsk region.
Information about the volume of Gross Regional Product of Arkhangelsk region for the period of 2011 – 2020 is presented in the table below
|
|
2011 |
2012 |
2013 |
2014 |
2015 |
2016 |
2017 |
2018 |
2019 |
2020 |
|
Gross Regional Product, bln RUB |
273,7 |
315,4 |
326,9 |
355,7 |
400,5 |
425,6 |
467,2 |
545,3 |
559,1 |
548,7 |
|
Volume GRP, % in comparison with the previous year |
110,1 |
104,0 |
102,0 |
101,1 |
100,1 |
99,2 |
103,8 |
102,9 |
100,6 |
98,2 |
The index of regional industrial production in 2021 in Arkhangelsk region
reached 101.0% to the level of 2020.
The increase in the indicator is due to the increase in the production index
in the extractive sector of the industry (by 24.1%). Of the manufacturing industries, an increase was noted in the production of beverages (by 11.2%), in the production of chemicals and chemical products - by 0.9%, in woodworking (by 4.3%), in ship repair (by 11.8%).
At the same time, there is a decrease in food production (by 7.4%),
in metallurgical production (by 38.3%), in shipbuilding (by 7.7%).
Indices of industrial production on major economic activities
in 2021 is presented in the table below
|
Economic activity |
The year of 2021 to the year of 2020, % |
|
Industrial production (total) |
101,0 |
|
Mining operations |
124,1 |
|
Processing production: |
97,1 |
|
food production |
92,6 |
|
beverage production |
111.2 |
|
timber processing, manufacture of wood and cork products, excluding furniture, wood shreds and wicker materials |
104.3 |
|
paper industry and paper products |
99.9 |
|
metallurgical production |
61.7 |
|
production of metal manufactures (excluding equipment |
85.4 |
|
production of electric equipment |
180.0 |
|
production of equipment and machinery excluded |
78.8 |
|
production of other equipment and transportation facilities |
92.3 |
|
maintenance and repair of machinery and equipment |
111.8 |
|
Electricity, gas and steam supply; air conditioning |
102.7 |
|
Water supply, water drainage, waste collection and anti-pollution activities |
105.6 |
Investments
The volume of investments to economy of Arkhangelsk region in 2021 amounted to 106.2 bln RUB, an increase to the rate of 2020 is 7.8%
(about 2.0 bln RUB).
Fishery
Access to the sea provides Arkhangelsk region with fish resources. About
98 thousand tons of fish was caught in 2021. Commercial output – more than
50 thousand tons.
Timber Complex of Arkhangelsk region
Arkhangelsk region is one of the leading forest industry regions
of Russia. The largest factories for chemical and mechanical processing of wood are located here.
Capacity for pulping is over 2.1 mln tons, for paper and cardboard product group – 1.6 mln tons, for production of sawn timber – 2.0 mln meters3, plywood – 145.0 thousand meters3, fuel pellets – 353.0 thousand tons.
The region provides a quarter of Russian pulp volumes, 9% of sawn timber, 28% of pellets. Since 2014, office paper has been produced in various formats
as well as import-substituting products such as coated paper.
In order to improve work of regional forestry complex, including creation
of conditions for effective innovations implementation, the Strategy
for Arkhangelsk region’s Forest Industry Complex Development
was adopted for the period until 2030.
Arkhangelsk region supplies coniferous lumber, birch plywood, bleached pulp, cardboard and paper products of various kinds, wood chemistry products, wood pellets to the markets. Pulp and paper production prevails
in the volume of shipped products.
Up to 80 countries worldwide import Arkhangelsk forest on a constant basis. Due to the geographically convenient location, the industry is focused
on supplying products abroad.
About 60% of market pulp, 40% of paper and cardboard product group’s products, about 65% of produced lumber are shipped outside the country
by sea transport through the ports of the cities of Arkhangelsk and Onega
and by rail. Major buyers of lumber in 2021 were Germany, France, the United Kingdom, the Netherlands, China, Azerbaijan and Egypt. Consumers of pulp
and paper and cardboard product group’s products are Poland, Germany, Republic of Korea, Italy, the United Kingdom, Belgium, Romania, neighboring countries, countries of central and southeast Asia.
Housing Construction
On the territory of Arkhangelsk region 422,6 thousand meters2
of housing were built in 2021, which is 20,1 % higher than the same period in 2020. Individual developers built 179.9 thousand meters2 of these, which is 26% higher than the level of 2020.
The largest share of the total housing area built in 2020 accounts
for the cities of Arkhangelsk (25.1%), Severodvinsk (20%), Kotlas (11.3%)
and Primorsky municipal district (9.9%).
Consumer Market
In 2021 retail turnover amounted to 301.7 bln RUB, which is an increase
by 2.7% to the level of 2020; turnover of food industry increased by 16,4 %
and amounted to 15,1 bln RUB.
In 2021 a share of food products in macrostructure of retail turnover was 51.7%, nonfood products – 48.3%.
The main volume of retail turnover is formed by organisations
that are not related to small and medium-sized businesses: in the structure of retail trade turnover in 2021, the share of such organisations was 44.9%. The share
of individual entrepreneurs (outside the market) was 30.1%, small businesses – 22.3%, medium-sized businesses – 2.4%, share of market and fair sales – 0.4%.
Living Standards
Average monthly income per capita in 2021 was 37 281.5 RUB with
an increase by 7% to the rate of 2020.
In 2021 average monthly wage in enterprise sector of Arkhangelsk region reached the amount of 57 396.9 RUB and increased by 8.6% in comparison with 2020. Real wages increased by 1.3%.
Foreign Trade
The foreign trade turnover of Arkhangelsk region within the period
of January – June, 2022 was 2052.8 mln USD and compared to the same period of the previous year increased by 25%, exports increase amounted to 42.3%, import value decreased by 60.7%. Correlation of cost volumes of exports and imports
in turnover amounted to 95:5.
Wood and pulp and paper products (31.6%), mineral products
(56.7%), machine-building products (6.1%) occupy leading positions in exports.
Structural shifts in exports are essential due to increase in export of oil and oil products as well as machine building production.
The share of machine-building production in imports was 81.3%,
and chemical industry production was 11.2%. Structural shifts in imports are negligible.
Arkhangelsk region foreign trade turnover dynamics
(mln USD)
|
Index |
2017 |
2018 |
2019 |
2020 |
2021 |
|
Export |
2406.441 |
2958.284 |
2540.212 |
2087.270 |
3218.422 |
|
Import |
192.870 |
232.300 |
281.474 |
232.225 |
367.168 |
|
Turnover |
2599.311 |
3190.584 |
2821.686 |
2319.495 |
3585.590 |
|
Balance |
2213.571 |
2725.984 |
2258.738 |
1088.045 |
2851.254 |
Export Operations of Arkhangelsk region
Export operations of regional companies are mainly focused on foreign market. By results of January – June, 2022 the volume of export to non-CIS countries amounted to 96.5% of total export volume.
Commodity Export Composition of Arkhangelsk region
(thousand USD)
|
Codes FEACN |
Item |
January – June, 2021 |
Export share
|
January – June, 2022 |
Export share
|
January – June, 2022 to January – June, 2021 |
|
01 - 24 |
Foodstuffs and agricultural raw materials |
46 661.8 |
3.4% |
52 254 |
2.7% |
112.0% |
|
25 - 27 |
Mineral products |
522 818.8 |
38.2% |
1 102 271.7 |
56.7% |
210.8% |
|
28 - 40 |
Chemical products, rubber |
4 370.5 |
0.3% |
3 140.6 |
0.2% |
71.9% |
|
41 - 43 |
Rawhide, furs and fur products |
42.7 |
0.0% |
0.4 |
0.0% |
1.0% |
|
44 - 49 |
Wood, pulp and paper products |
654 542.9 |
47.9% |
613 839.5 |
31.6% |
93.8% |
|
50 - 67 |
Textiles, textile products, footwear |
120.0 |
0.0% |
3 140.6 |
0.2% |
71.9% |
|
72 - 83 |
Metals, metal products |
6 666.5 |
0.5% |
502.8 |
0.0% |
7.5% |
|
84 - 90 |
Machinery, equipment and vehicles |
8 451.7 |
0.6% |
117 656.8 |
6.0% |
1392.1% |
|
|
Others |
243 762.4 |
11.7% |
55 394.0 |
2.8% |
44.9% |
Import Operations of the Arkhangelsk region
Priority of goods import in Arkhangelsk region in terms of value belongs
to non-CIS countries.
By results of January – June, 2022 the share of supplies from non-CIS countries amounted to 94.9% of the region's imports.
Commodity Import Composition of Arkhangelsk region
(thousand USD)
|
Codes FEACN |
Item |
January – June, 2021 |
Import Share |
2021 |
Import Share |
2021 to 2020 |
|
01 - 24 |
Foodstuffs and agricultural raw materials (except textile materials) |
5 285.6 |
1.9% |
2 792.81 |
2.6% |
52.8% |
|
25 - 27 |
Mineral products |
2.0 |
0.0% |
9.35 |
0.0% |
467.5% |
|
28 - 40 |
Chemical products, rubber |
11 509.6 |
4.2% |
12 037.02 |
11.2% |
104.6% |
|
41 - 43 |
Rawhide, furs and fur products |
48.5 |
0.0% |
0.44 |
0.0% |
0.9% |
|
44 - 49 |
Wood, pulp and paper products |
690.2 |
0.3% |
656.19 |
0.6% |
95.1% |
|
50 - 67 |
Textiles, textile products, footwear |
1 550.2 |
0.6% |
1 350.46 |
1.5%
|
87.1% |
|
72 - 83 |
Metals, metal products |
2 651.2 |
1.0% |
2.2% |
88.0% |
2.2% |
|
84 - 90 |
Machinery, equipment and vehicles |
250 874.8 |
91.6% |
81.3% |
34.8% |
81.3% |
|
|
Others |
929.3 |
0.9% |
943.90 |
0.9% |
76.3% |


